Introduction
The T3 protocol is WebLogic's fast native binary protocol that is used for most inter-server communication, and by default, communication to a WebLogic server from client applications using RMI, EJB or JMS, for example. If a JMS distributed queue or an RMI/EJB based application is deployed to a WebLogic cluster, for high availability, the client application needs a way of addressing the "virtual endpoint" of the remote clustered service. Subsequent client messages sent to the service then need to be load-balanced and failed-over, when necessary. For WebLogic, the client application achieves this in two phases:
- Addressing the virtual endpoint of the clustered service. The client Java code populates a "Provider URL" property with the address of the WebLogic cluster, to enable the "InitialContext" to be bootstrapped. As per the Weblogic JNDI documentation, "this address may be either a DNS host name that maps to multiple IP addresses or a comma separated list of single address host names or IP addresses". Essentially this virtual endpoint URL is only ever used by the client, to connect to a random server in the cluster, for creating the InitialContext. The URL is not used for any further interaction between client and clustered servers and does not influence how any of the subsequent T3 messages are routed.
- Load-balancing JNDI/RMI/EJB/JMS messaging to the clustered service. Once the InitialContext is obtained by the client application, all JNDI lookups and subsequent RMI/EJB/JMS remote invocations, use WebLogic generated "cluster-aware" stubs, under the covers. These stubs are populated with the list of clustered managed server direct connection URLs and the stub directly manages load-balancing and failover of T3 requests across the cluster. When a particular server is down, the stub will route new requests to another server, from the cluster list it maintains. Under certain circumstances, such as cases where no servers in the stub's current cluster list are reachable any more, the stub will be dynamically refreshed with a new version of the cluster list, to try. The stub's list of cluster membership URLs is unrelated to the fixed URL that is used for phase 1 above.
It is not required or even supported to use an External Load Balancer for load-balancing the subsequent JNDI/RMI/EJB/JMS interaction over T3 (i.e phase 2 above). The WebLogic generated stubs already perform this role and are far more adept at it. Additionally, many of these T3 based interactions are stateful, which the stubs are aware of and help manage. So attempting to also introduce an External Load Balancer in the message path will break this stateful interaction. These rules are explicitly stated in the WebLogic EJB/RMI documentation which concludes "when using the t3 protocol with external load balancers, you must ensure that only the initial context request is routed through the load balancers, and that subsequent requests are routed and controlled using WebLogic Server load balancing".
Oracle Traffic Director
Oracle Traffic Director (OTD) is a layer-7 software load-balancer for use on Exalogic. It includes many performance related characteristics, plus high availability features to avoid the load-balancer from being a "single point of failure". OTD has been around for approximately 2 years and has typically been used to virtualise HTTP endpoints for WebLogic deployed Web Applications and Web Services. A new version of OTD has recently been released (see download site + online documentation), that adds some interesting new features, including the ability to load-balance generic TCP based requests. An example use case for this, is to provide a single virtual endpoint to client applications, to access a set of replicated LDAP servers as a single logical LDAP instance. Another example use case, is to virtualise the T3 endpoint for WebLogic client applications to bootstrap the InitialContext, which is precisely what I will demonstrate in the rest of this blog entry.
Configuring OTD to Load Balance the T3 Bootstrap of the InitialContext
I used my Linux x86-64 laptop to test OTD based TCP load-balancing. I generated and started up a simple Weblogic version 10.3.6 domain containing a cluster of two managed servers with default listen addresses set to "locahost:7001" and "localhost:7011" respectively. I also deployed a simple EJB application targeted to the cluster (see next section).
I then installed OTD version 11.1.1.7 and created a simple OTD admin-server and launched its browser based admin console. In the admin console, I could see a new section ready to list "TCP Proxies", in addition to the existing section to list "Virtual Servers" for HTTP(S) end-points, as shown in the screenshot below.

(click image for larger view)
To create the TCP Proxy configuration I required, to represent a virtual endpoint for my WebLogic cluster, I chose the 'New Configuration' option and was presented with Step 1 of a wizard, as shown in the screenshot below.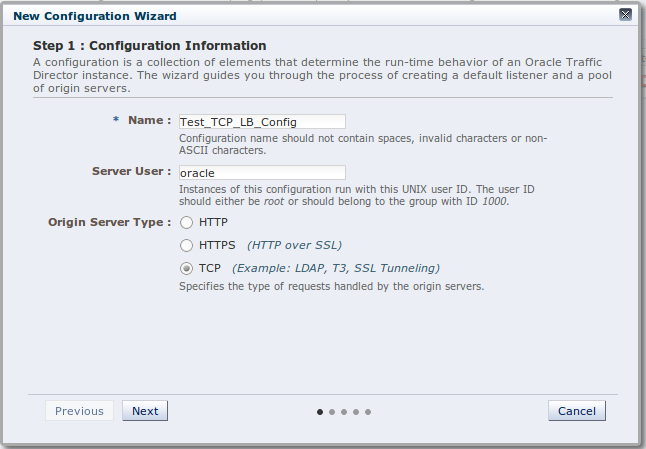
(click image for larger view)
In this Step 1, I provided a configuration name and an OS user name to run the listener instance under, and I selected the TCP radio button, rather than the usual HTTP(S) ones. In Step 2 (shown below), I defined the new listener host and port for this TCP Proxy, which in this case I nominated as port 9001 using the loopback address of my laptop.
(click image for larger view)
In Step 3 (shown below), I then provided the details of the listen addresses and ports for my two running WebLogic managed servers that needed to be proxied to, which is listen on localhost:7001 and localhost:7011 respectively.
(click image for larger view)
In the remaining two wizard steps (not shown), I selected the local OTD node to deploy to and reviewed the summary of the proposed configuration before hitting the 'Create Configuration' button. Once created, I went to the "Instances" view in the OTD admin console and hit the "Start/Restart" button to start my configured TCP Proxy up, listening on port 9001 of localhost.
(click image for larger view)
At this point, I assumed that I had correctly configured an OTD TCP Proxy to virtualize a Weblogic clustered T3 InitialContext endpoint, so I then needed to prove it worked....Example Deployed Stateless Session Bean for the Test
I created a simple stateless session bean (including home interface) and deployed it as an EJB-JAR to Weblogic, targeted to my running cluster. The EJB interface for this is shown below and the implementation simply receives a text message from a client application and prints this message to the system-out, before sending an acknowledgement text message back to the client.
public interface Example extends EJBObject {
public String sendReceiveMessage(String msg) throws RemoteException;
}
Example EJB Client Code for the Test
I then coded a simple standalone Java test client application in a single main class, as shown below, to invoke the remote EJB's sole business method (I've not listed the surrounding class & method definition and try-catch-finally exception handling code, for the sake of brevity).
Hashtable env = new Hashtable();
env.put(Context.INITIAL_CONTEXT_FACTORY,
"weblogic.jndi.WLInitialContextFactory");
env.put(Context.PROVIDER_URL, "t3://localhost:9001");
System.out.println("1: Obtaining initial context");
ctx = new InitialContext(env);
System.out.println("2: Sleeping for 10 secs having got initial context");
Thread.sleep(10 * 1000);
System.out.println("3: Obtaining EJB home interface using JNDI lookup");
ExampleHome home = (ExampleHome) PortableRemoteObject.narrow(
ctx.lookup("ejb.ExampleEJB"), ExampleHome.class);
System.out.println("4: Sleeping for 10 secs having retrieved EJB home interface");
Thread.sleep(10 * 1000);
System.out.println("5: Creating EJB home");
Example exampleEJB = home.create();
System.out.println("6: Sleeping for 10 secs having got EJB home");
Thread.sleep(10 * 1000);
System.out.println("7: Start of indefinite loop");
while (true) {
System.out.println("7a: Calling EJB remote method");
String msg = exampleEJB.sendReceiveMessage("Hello from client");
System.out.println("7b: Received response from EJB call: " + msg);
System.out.println("7c: Sleeping for 10 secs before looping again");
Thread.sleep(10 * 1000);
}
I included Java code to bootstrap the InitialContext, perform the JNDI lookup of the EJB home, create the EJB remote client instance and invoke the EJB's sendReceiveMessage() method, which are all shown in bold. Additionally, I included various debug print statements, a few 10 second pauses and a while loop (shown in non-bold) to space out the important client-to-server interactions, for reasons that I'll allude to later.
As can be seen in the code, the Provider URL address I used for the InitialContext was "localhost:9001", which is the OTD TCP Proxy endpoint I'd configured, rather than the direct address of the clustered managed servers (which would have been hard-coded to "localhost:7001,localhost:7011", for example). I compiled this client application using a JDK 1.6 "javac" compiler, and ensured that whenever I ran the client application with a Java 1.6 JRE, I included the relevant WebLogic JAR on the classpath.
Test Runs and WebLogic Configuration Change
With my WebLogic clustered servers running (ports 7001 & 7011), and my OTD TCP Proxy listener running (port 9001), I ran the test client application and hit a problem immediately In the system-out for one of the managed servers, the following error was shown:
<02-Apr-2013 15:53:00 o'clock GMT> <Error> <RJVM> <BEA-000572> <The server rejected a connection attempt JVMMessage from:
'-561770856250762161C:127.0.1.1R:-5037874633160149671S:localhost:localhost:7001,localhost:7011:MyDemoSystemDomain:MyDemoSystemServer2' to: '0B:127.0.0.1:[9001,-1,-1,-1,-1,-1,-1]' cmd: 'CMD_IDENTIFY_REQUEST', QOS: '101', responseId: '-1', invokableId: '-1', flags: 'JVMIDs Sent, TX Context Not Sent, 0x1', abbrev offset: '105' probably due to an incorrect firewall configuration or admin command.>
In the client application's terminal, the following error was subsequently shown:
javax.naming.CommunicationException [Root exception is java.net.ConnectException: t3://localhost:9001: Bootstrap to: localhost/127.0.0.1:9001' over: 't3' got an error or timed out]
Caused by: java.net.ConnectException: t3://localhost:9001: Bootstrap to: localhost/127.0.0.1:9001' over: 't3' got an error or timed out
After some investigation, I found that the My Oracle Support knowledge base contained a document (ID 860340.1) which defines this expected WebLogic behaviour and provides the solution. By default, WebLogic expects any remote T3 access to have been initiated by the client, using the same port number that the proxied request actually hits a port of the WebLogic server on. In my case, because I was running this all on one machine, the port referenced by the client was port 9001 but the port hit on the Weblogic Server was 7001. As recommended in the knowledge base document, I was able to avoid this benign server-side check from being enforced, by including a JVM-level parameter (see below) in the start-up command line for my WebLogic servers. I then re-started both managed servers in the cluster to pick up this new parameter.
-Dweblogic.rjvm.enableprotocolswitch=true
This time, when I ran the client application, it successfully invoked the remote EJB. No errors were shown in the output of the clustered managed servers, and instead the system-out of one the managed servers showed the following, confirming that the EJB had been called.
class example.ExampleEJB_ivy2sm_Impl EJB received message: Hello from client
(output repeats indefinitely)
On the client side, the expected output was also logged, as shown below.
1: Obtaining initial context
2: Sleeping for 10 secs having got initial context
3: Obtaining EJB home interface using JNDI lookup
4: Sleeping for 10 secs having retrieved EJB home interface
5: Creating EJB home
6: Sleeping for 10 secs having got EJB home
7: Start of indefinite loop
7a: Calling EJB remote method
7b: Received response from EJB call: Request successfully received by EJB
7c: Sleeping for 10 secs before looping again
(output 7a to 7c repeats indefinitely)
Proving OTD is not in the Network Path for T3 Stub Load-Balancing
The reason why my test client code includes 10 second pauses and debug system-out logging, is to enable me to observe what happens when I kill various WebLogic and/or OTD servers, part way through client application test runs.
One of the main scenarios I was interested in was to allow the client to bootstrap the InitalContext via the OTD configured TCP Proxy listening on localhost:9001, then terminate the OTD instance/listener process. OTD would be stopped whilst the client application was still in the first 10 second pause, and before the client application had a chance to perform any JNDI lookup or EJB operations. By doing this I wanted to prove that once a client application bootstraps an InitialContext, the Provider URL (eg. "localhost:9001") would subsequently be ignored and the cluster-aware T3 stub, dynamically generated for the client application, would take over the role of routing messages, directly to the clustered managed servers.
Upon re-running the client and stopping the OTD listener, after the client application logged the message "2: Sleeping for 10 secs having got initial context", it continued to work normally. After 10 seconds, it woke up and correctly performed the JNDI lookup of the EJB home, called the remote EJB home create() method and then called the remote EJB business method, logging each of these steps to system-out on the way. This proved that the InitialContext Provider URL is not used for the JNDI lookups or EJB invocations.
To further explore this, I also re-ran the scenario, after first starting Wireshark to sniff all local loopback network interface related traffic. I inspected the content of the T3 messages in the Wireshark captured network traffic logs. I observed that in some of the T3 messages, the responding managed server was indicating the current cluster address as being "localhost:7001,localhost:7011". Upon terminating the first of the two managed servers in the cluster (whilst the client application was still running in its continuous loop), I observed that subsequent cluster address metadata in the T3 responses from the second managed server, back to the client, showed the current cluster address as just "localhost:7011".
I ran one final test. With the WebLogic cluster of two managed servers running, but the OTD TCP Proxy Listener instance not running, I re-ran the client application again from start to end. As soon as the application started and attempted to bootstrap the InitialContext it failed, as expected, with the following logged to system-out.
1: Obtaining initial context
javax.naming.CommunicationException [Root exception is java.net.ConnectException: t3://localhost:9001: Destination unreachable; nested exception is:
java.net.ConnectException: Connection refused; No available router to destination]
at weblogic.jndi.internal.ExceptionTranslator.toNamingException(ExceptionTranslator.java:40)
at weblogic.jndi.WLInitialContextFactoryDelegate.toNamingException(WLInitialContextFactoryDelegate.java:792)
at weblogic.jndi.WLInitialContextFactoryDelegate.getInitialContext(WLInitialContextFactoryDelegate.java:368)
at weblogic.jndi.Environment.getContext(Environment.java:315)
at weblogic.jndi.Environment.getContext(Environment.java:285)
at weblogic.jndi.WLInitialContextFactory.getInitialContext(WLInitialContextFactory.java:117)
at javax.naming.spi.NamingManager.getInitialContext(NamingManager.java:667)
at javax.naming.InitialContext.getDefaultInitCtx(InitialContext.java:288)
at javax.naming.InitialContext.init(InitialContext.java:223)
at javax.naming.InitialContext.
at client.RunEJBClient.main(RunEJBClient.java:19)
This showed that the client application was indeed attempting to bootstrap the InitialContext using the Provider URL of "localhost:9001". In this instance, the TCP proxy endpoint, that I'd configured in OTD, was not available, so the URL was not reachable. This proved that the client application was not magically discovering the cluster address from a cold-start and does indeed rely on a suitable Provider URL being provided, to bootstrap the InitialContext.
Summary
In this blog entry, I have shown how an external load balancer can be used to provide a virtualised endpoint for WebLogic client applications to reference, to bootstrap the InitialContext from a WebLogic cluster. In these particular tests, the load balancer product used was the latest version of OTD, with its new "TCP Proxy" capability. However, most of the findings are applicable to environments that employ other types of load balancers, including hardware load balancers.
I have also shown that, other than for InitialContext bootstrapping, an external load balancer will not be used for subsequent T3 load-balancing. Instead, the cluster-aware T3 stubs, that are dynamically loaded into client applications, automatically take on this role.
For production environments, system administrators still have the choice of mapping a DNS hostname to multiple IP addresses, to provide a single logical hostname address representing a WebLogic cluster. However, in some data-centres, it may be more convenient for a system administrator to re-use an existing load balancer technology, that is already in place, to virtualise the endpoint and provide a single logical address for a cluster. This may be the case if it is much quicker for a system administrator to make frequent and on-demand configuration changes to a load balancer, rather than continuously raising tickets with the network team, to update DNS entries.
Song for today: Pace by Sophia


